The Datadog Custom Resources (CRDs)
Kubernetes was designed from the very beginning as “API centric”. Almost everything in Kubernetes can be expressed as an API resource (usually as a YAML file) and kept on git with the rest of your infrastructure configuration. These resources are a way to express the desired state of your cluster.
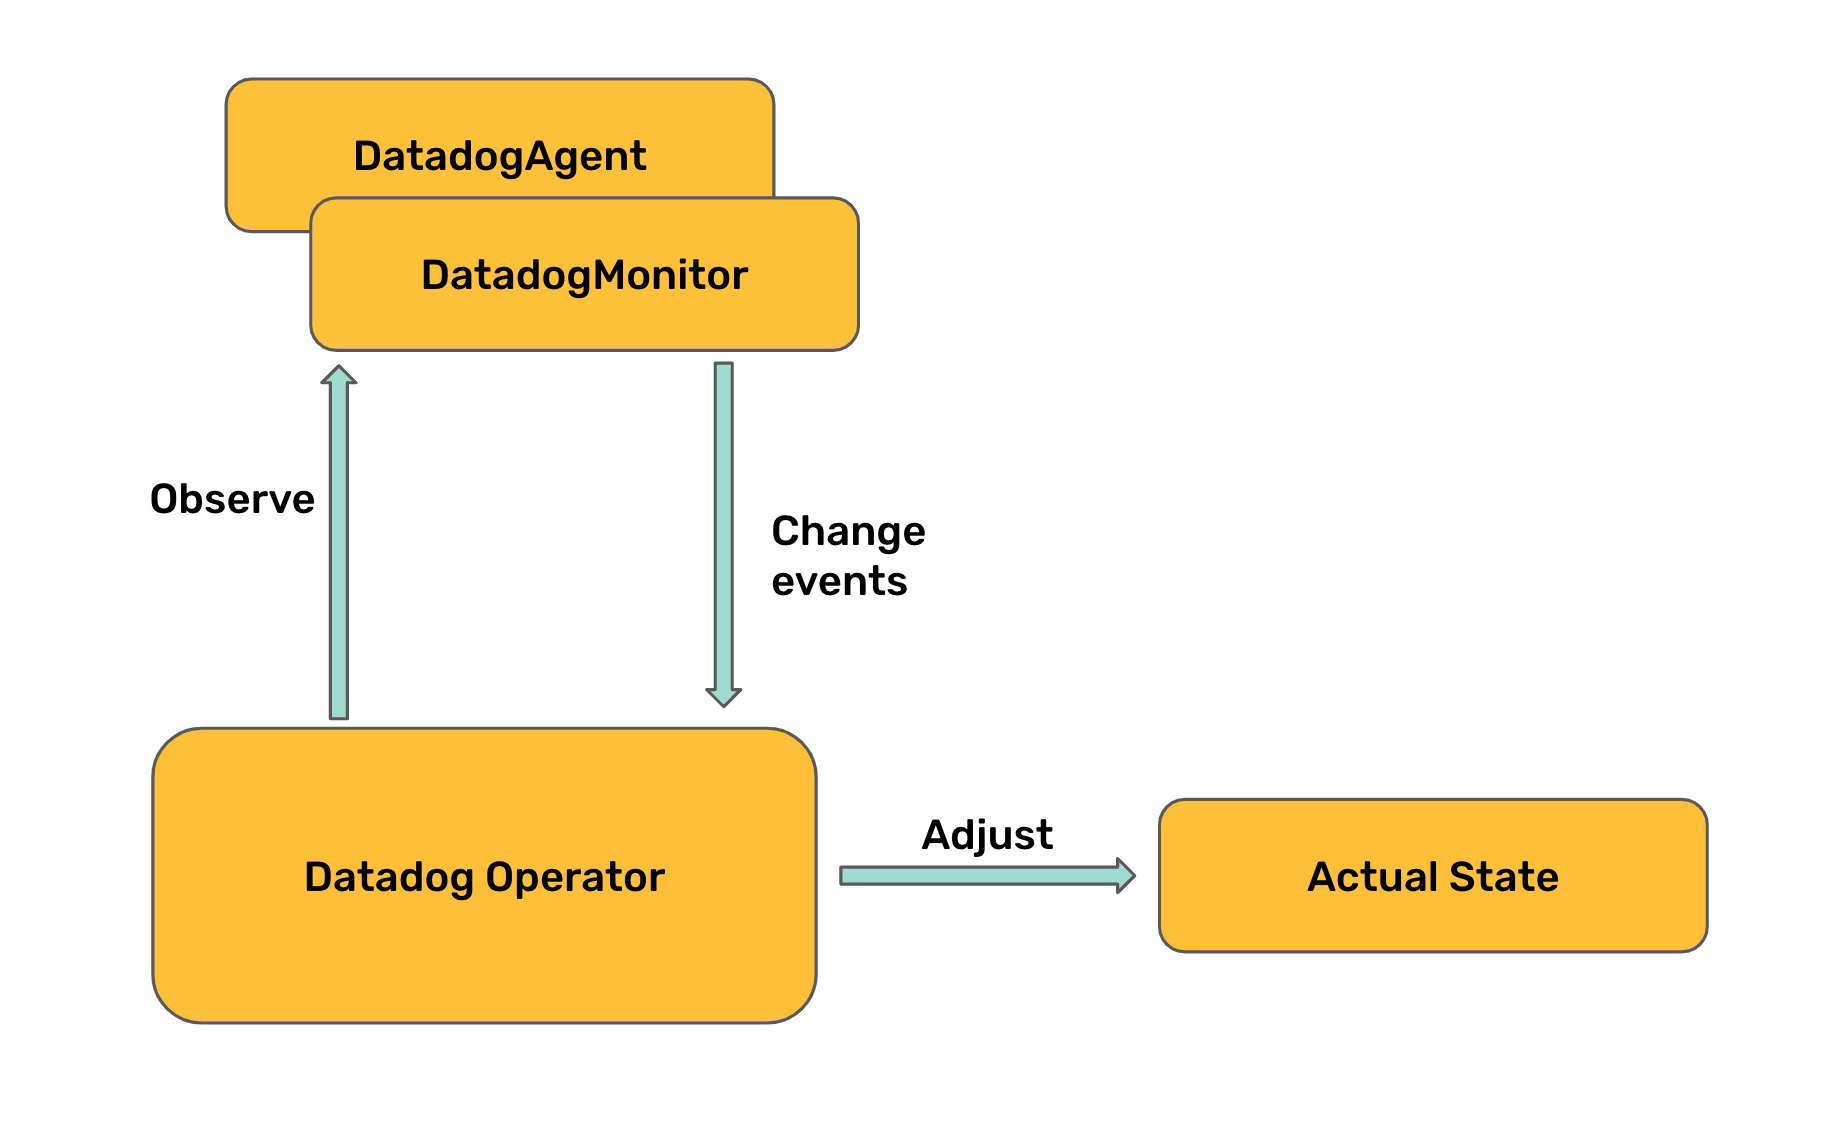
Once these resources are applied to your cluster, there is a set of Kubernetes components called controllers that will apply the needed changes to the cluster to ensure that the actual state of the cluster is the desired state, following a true declarative model.
The success of the KRM is that this model can also be used to extend the Kubernetes API and to manage objects inside and outside the cluster in the same way. Datadog has created a set of new Kubernetes custom resources (CRDs) to manage Datadog cluster and in-app components.
In this post we’ll explain the Datadog related CRDs that are available, how to use them and why they are very useful if you are using Datadog to monitor your Kubernetes infrastructure and applications.
The Datadog Operator
The Datadog Operator is the Kubernetes controller that will manage the reconciliation loop for some Datadog related resources. The Datadog Operator, once deployed in a Kubernetes cluster, will watch the Kubernetes API for any changes related to these resources, and will make the needed changes in the cluster or in the Datadog API.

To deploy the Datadog Operator in your cluster you can use Helm:
export DD_API_KEY=<YOUR_DD_API_KEY>
export DD_APP_KEY=<YOUR_DD_APP_KEY>

helm install my-datadog-operator datadog/datadog-operator --set apiKey=${DD_API_KEY} --set appKey=${DD_APP_KEY} --set datadogMonitor.enabled=true
We will also create a Kubernetes secret to keep our Datadog API and APP keys:
kubectl create secret generic datadog-secret --from-literal=api-key=${DD_API_KEY} --from-literal=app-key=${DD_APP_KEY}
DatadogAgent
The DatadogAgent is the resource to manage your Datadog agents deployments. Instead of having to craft a complex Helm values.yaml file, the idea behind using DatadogAgent is to describe what Datadog features are needed in a cluster, and the Datadog Operator will deploy the needed Kubernetes resources to fulfill those requirements.
Let’s take a look at an example:
apiVersion: datadoghq.com/v1alpha1
kind: DatadogAgent
metadata:
  name: datadog
spec:
  clusterName: crds
  credentials:
    apiSecret:
      secretName: datadog-secret
      keyName: api-key
    appSecret:
      secretName: datadog-secret
      keyName: app-key
  agent:
    config:
      kubelet:
        tlsVerify: false
  clusterAgent:
    config:
      externalMetrics:
        enabled: true
        useDatadogMetrics: true
      admissionController:
        enabled: true
In this example we have set the name of the cluster and we have referenced the secret with our Datadog keys. Then we have selected some options for both the Node Agent and the Cluster Agent.
In the case of the Node Agent, we have accepted self-signed certificates for the Kubelet. For the Cluster Agent we have enabled the external metrics server and the admission controllers.
Let’s apply this object:
kubectl apply -f datadogagent-basic.yaml
This creates a DatadogAgent resource that can be explored:
kubectl describe datadogagent datadog
You will see all the different Kubernetes resources that were created:
[...]
Events:
  Type    Reason                      Age    From          Message
  ----    ------                      ----   ----          -------
  Normal  Create Secret               8m39s  DatadogAgent  default/datadog
  Normal  Create Service              8m39s  DatadogAgent  default/datadog-cluster-agent
  Normal  Create PodDisruptionBudget  8m39s  DatadogAgent  default/datadog-cluster-agent
  Normal  Create ServiceAccount       8m39s  DatadogAgent  default/datadog-cluster-agent
  Normal  Create ClusterRole          8m39s  DatadogAgent  /datadog-cluster-agent
[...]
These resources are created in a specific order, to make sure that all prerequisites for some of the resources are met.
In particular, it creates a Deployment for the Cluster Agent and a Daemonset for the Node Agent, with the right configuration options based on the chosen options:
kubectl get daemonset

NAME            DESIRED   CURRENT   READY   UP-TO-DATE   AVAILABLE   NODE SELECTOR   AGE
datadog-agent   1         1         1       1            1           <none>          105m

kubectl get deployment

NAME                    READY   UP-TO-DATE   AVAILABLE   AGE
datadog-cluster-agent   1/1     1            1           106m
All the possible configuration options for the DatadogAgent resource are available in its documentation.
DatadogMonitor
DatadogMonitor is a resource that allows you to manage your Datadog Monitors using resource definitions that can be maintained with the rest of your cluster configuration.
This is very useful, as it allows you to review changes to your application or infrastructure alongside potential changes needed for the monitors that alert on them.
Let’s look at an example:
kind: DatadogMonitor
metadata:
  name: pods-restarting
spec:
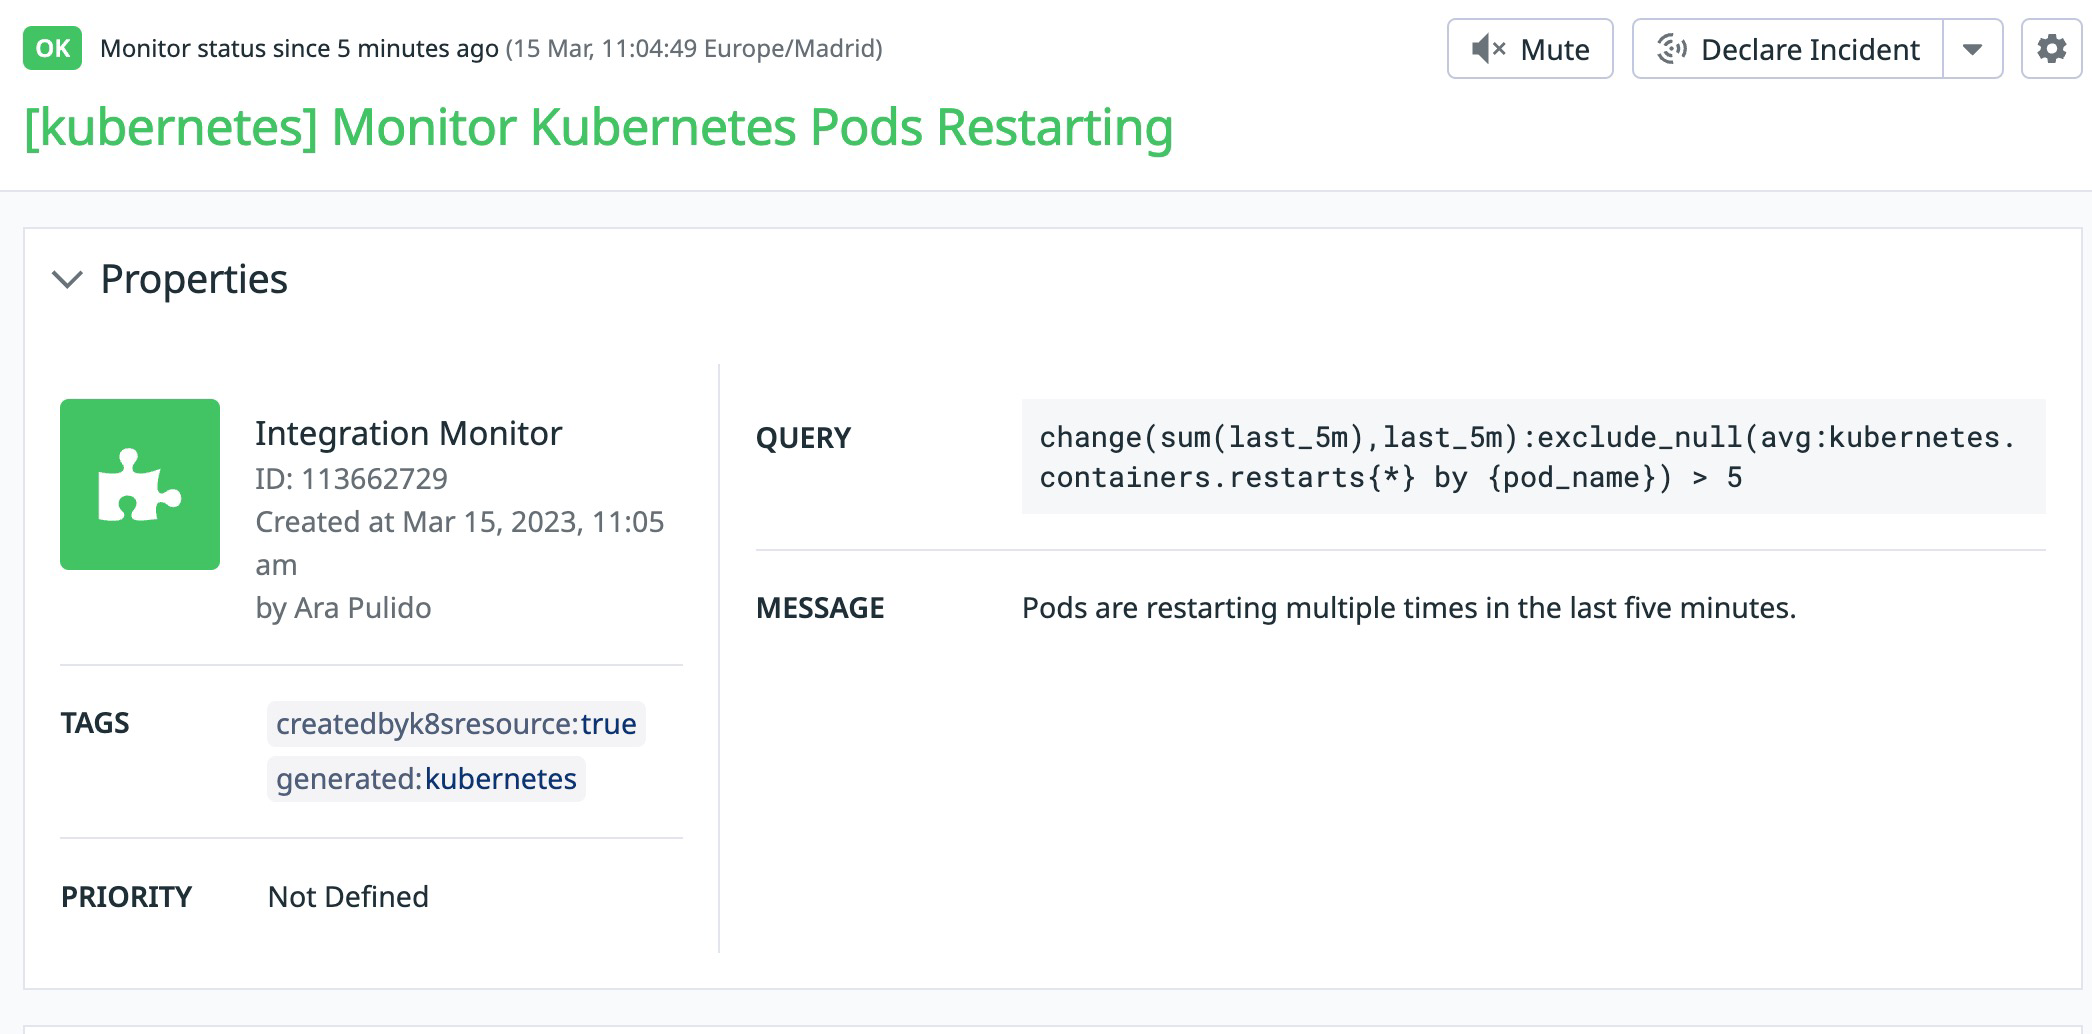
  query: "change(sum(last_5m),last_5m):exclude_null(avg:kubernetes.containers.restarts{*} by {pod_name}) > 5"
  type: "query alert"
  name: "[kubernetes] Monitor Kubernetes Pods Restarting"
  message: "Pods are restarting multiple times in the last five minutes."
  tags:
    - "createdbyk8sresource:true"
The DatadogMonitor resource is fairly simple. It includes a type and a query. The example above uses type “query alert”, that creates a Monitor that alerts on a specific Datadog query.
Let’s apply that resource:
kubectl apply -f datadogmonitor.yaml
Once created, we can see the monitor being created in our Datadog account:

As any other Kubernetes resource, we can also have a look to the state of the resource using kubectl:
kubectl get datadogmonitor

NAME              ID          MONITOR STATE   LAST TRANSITION        LAST SYNC              SYNC STATUS   AGE
pods-restarting   113662729   OK              2023-03-15T10:06:49Z   2023-03-15T10:10:49Z   OK            5m52s
You can find a set of examples for DatadogMonitor resources with their different monitor types in their git repository.
DatadogMetric
The Datadog Cluster Agent can also work as a Custom Metrics Server for Kubernetes. Meaning, you can use the metrics you have in Datadog to drive scaling your Kubernetes Deployments with the Horizontal Pod Autoscaler (HPA).
Once you’ve enabled the External Metrics Server in the Cluster Agent, you can create HPA resources that query a specific Datadog metric and set a target for that metric:
kind: HorizontalPodAutoscaler
[...]
metadata:
  name: nginxext
  metrics:
  - type: External
    external:
      metric:
        name: nginx.net.request_per_s
      target:
        type: AverageValue
        averageValue: 9
But the HPA resource definition is a bit restricted. It is very unlikely that you want to drive your scaling events based on a single metric value.
In general, you may want to drive your scaling events based on a more complex Datadog query, and this is where DatadogMetric can be useful.
Let’s have a look to this example:
apiVersion: datadoghq.com/v1alpha1
kind: DatadogMetric
metadata:
  name: nginx-requests
  namespace:nginx-demo
spec:
  query: max:nginx.net.request_per_s{kube_container_name:nginx}.rollup(60)
The Cluster Agent acts as the Kubernetes controller for DatadogMetric resources, so the Datadog Operator is not required in order to use those.
Once this resource is created, the Cluster Agent will update the value of that query using the Datadog API and will expose the result as a new metric in its External Metrics Server. This “new” metric can now be used in an HPA object. The name of this new metric will take the following pattern: datadogmetric@<namespace>:<datadogmetric_name>
So, for the example above, you could create an HPA object with the following specification:
kind: HorizontalPodAutoscaler
[...]
metadata:
  name: nginxext
  metrics:
  - type: External
    external:
      metricName: datadogmetric@nginx-demo:nginx-requests
      targetAverageValue: 9
Summary
The Kubernetes Design Model is a great way to adopt a declarative configuration approach for resources inside, but also outside the cluster.
Datadog extends the Kubernetes API with 3 new resources: DatadogAgent, DatadogMonitor, and DatadogMetric, that allow Datadog users to manage their Datadog configuration following the same Kubernetes model.